Data and Analytics
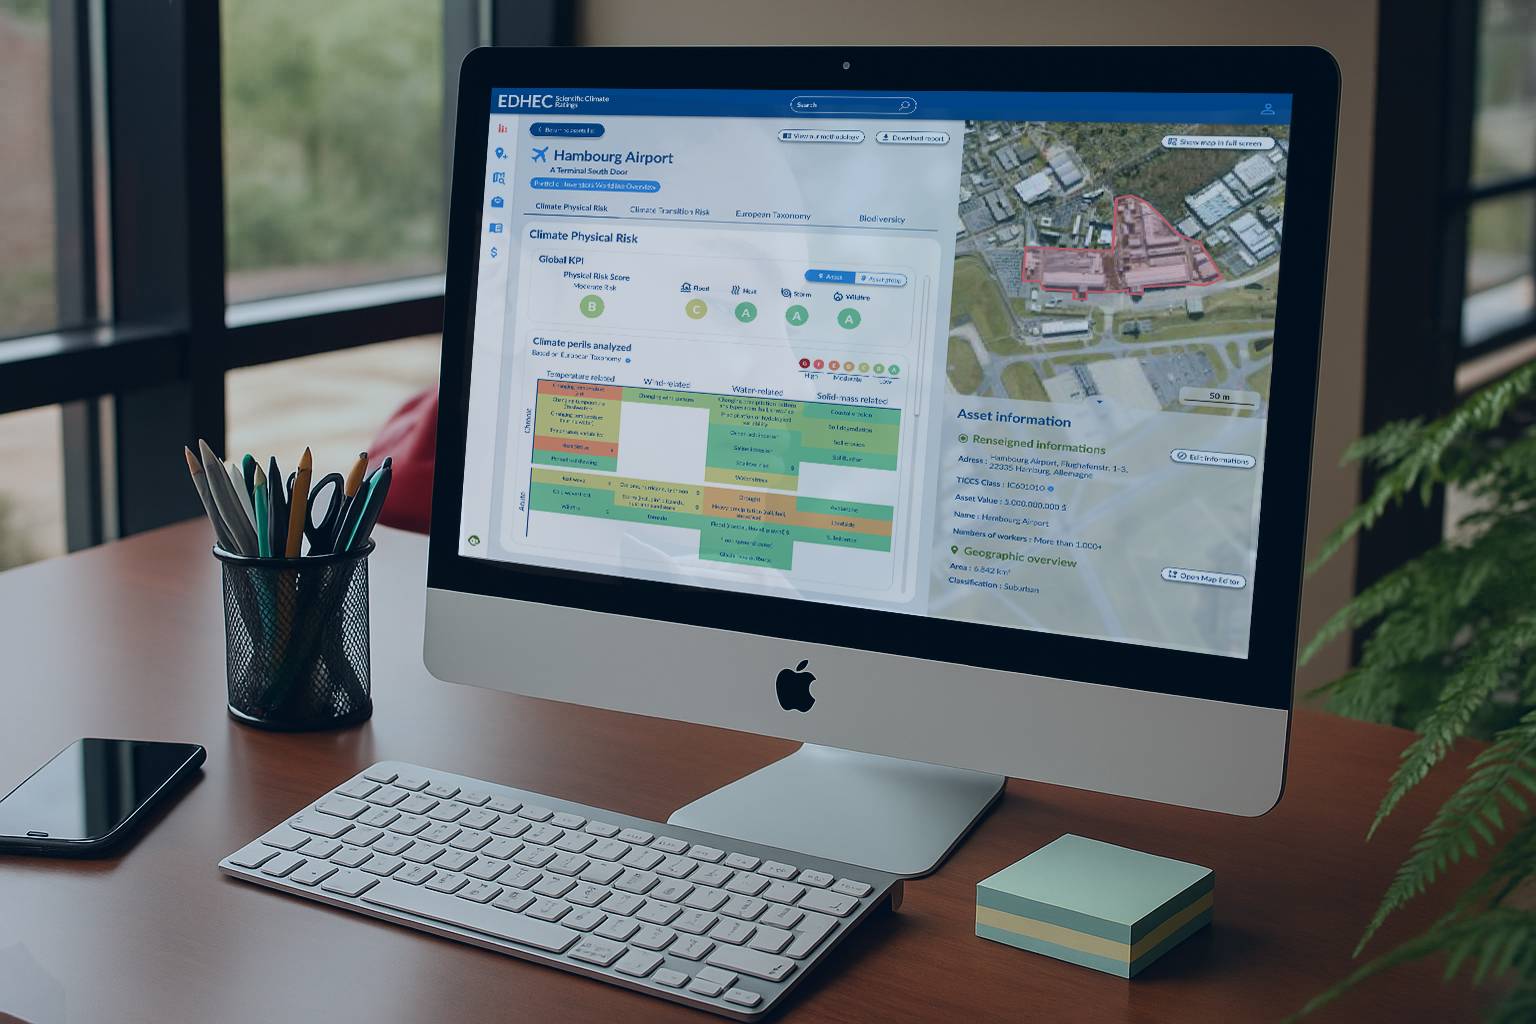
ClimateMetrics - Our On-Demand Platform
Extreme weather events have increased by 83 per cent since 1980, and rising global temperatures further increase the frequency and severity of climate hazards, leading to devastating human and financial costs (UNDRR, 2020).
At Scientific Climate Ratings, we have the ambition to be at the forefront of climate action, empowering businesses to understand, adapt, and thrive in the face of climate change. By connecting science with actionable solutions, we enable our clients to make informed decisions that drive sustainable growth and future-proof their operations in a rapidly changing world.
Together with ClimaTech, the world’s most extensive database of adaptation and mitigation strategies, our platform enables comprehensive risk assessment and future-ready decision-making.
Why Choose ClimateMetrics
Future-proof your business with ease
- Our intuitive platform enables you to develop actionable strategies that not only mitigate climate risk but also fortify your business’s resilience.
- With built-in adaptability, our tool automatically fills in gaps where data may be missing, ensuring comprehensive risk assessment at all times.
- Benefit from modular, granular outcomes—whether assessing individual assets or entire portfolios—covering everything from exposure levels to financial impacts of climate risks.
Gain deep insights into your climate risk exposure
- Leverage the power of the Scientific Climate Ratings robust climate-conditioned financial models. Our state-of-the-art platform provides data-driven insights which simplify the complexities of climate risk and resilience.
- We translate your climate exposure into clear financial terms across multiple scenarios and timeframes, equipping you with the data you need to make informed, forward-thinking decisions.
Comprehensive risk simulations at your fingertips
- Simulate various climate risk scenarios across different time horizons and mitigation strategies, all in one easy-to-use platform.
You want to experience ClimateMetrics in action?
Our experts will be happy to help.
Physical Risk
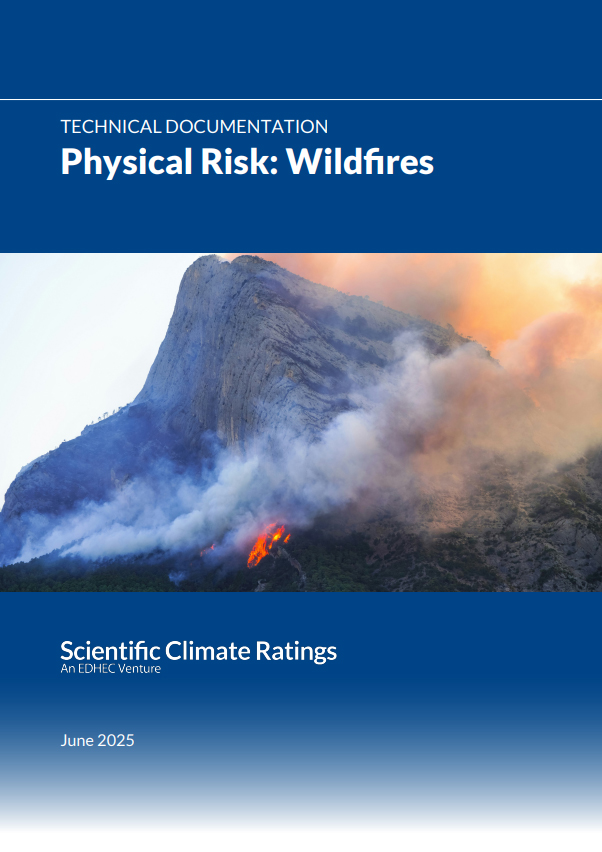
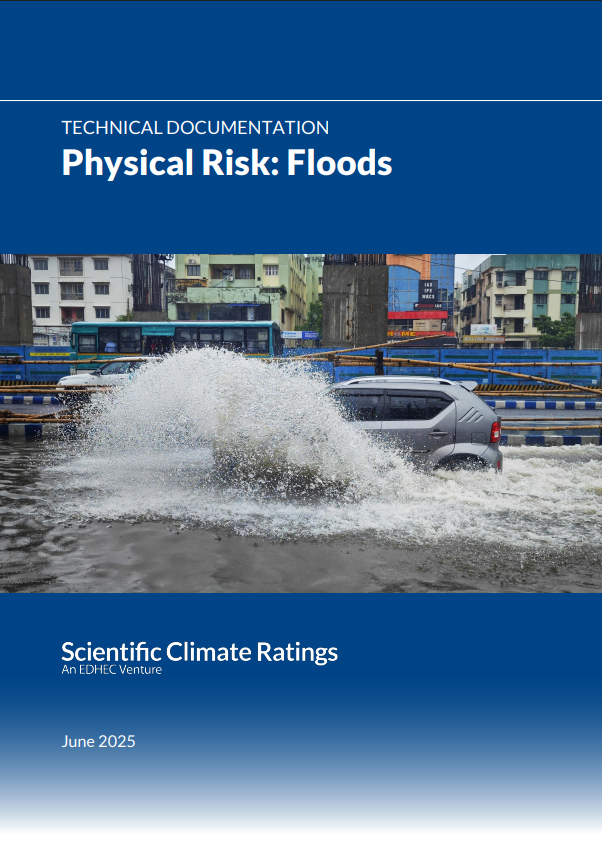
Physical risks refer to the potential damage from acute extreme weather events and chronic changes in weather patterns due to climate change. These risks increase in scenarios where global carbon emissions are not reduced. In addition to the four hazard types captured by our ratings (floods, storms, wildfires, and heat stress), our data covers the main physical risks as identified by the EU Taxonomy Regulation.
We measure the damage and disruption to infrastructure assets and their operations caused by extreme climate events.
Physical Risk Key Metrics
Physical Damage at Risk
(PDaR)
Physical Value at Risk
(PVaR)
5 scale
Physical Risk Score
* Could be expressed in revenue loss when relevant
** We can provide relative of absolute change between NAV without and with physical damages
Decoding Physical Climate Risk: Find the Answers You Need (FAQ section)
Our models allow us to calculate the impact on assets’ Net Asset Values (NAVs) resulting from physical damage and disruptions. This percentage value provides companies with an understanding of the financial materiality of physical risks until two time horizons: 2035 and 2050. This calculation is reflected in the Climate Risk Rating (CRR).
Yes, we include climate scenarios in our models to consider the increase in future damages. For physical risks, we consider two Representative Concentration Pathways (RCPs), RCP4.5 and RCP8.5, which we align with all major climate scenarios.
We cover damage from floods, storms, wildfires, and heat stress. According to the UNDRR (2020), floods and storms are the most common climate-related hazard events, accounting for approximately 44% and 28% of all climate events between 2000 and 2019, while extreme temperatures account for 6% and wildfires for 3%. Additionally, the majority of research focuses on these hazard types and provides damage functions and other indicators that allow us to measure damage and disruption caused by such climate events.
We review our models and metrics on an annual basis, which may result in updates to incorporate the latest input data sources (e.g., updated hazard maps, revised damage functions, new research findings, or changes in company information).
- Floods: flood depth in a global 10m by 10m resolution
- Extratropical storms: max. wind gust in a global 0.25° by 0.25° resolution
- Tropical cyclones: max. wind speed in a global 11km by 11km resolution
- Wildfires: burnt date in a global 500m by 500m resolution
- Heat stress: Wet Bulb Globe Temperature in a global 25km by 25km resolution
For some hazards, we use several indicators. Please refer to our technical documents on physical risks for more details.
Must-haves:
- Asset’s location: name, address (with postal code), ideally coordinates (latitude & longitude)
- Type of asset: sector (ideally, specific TICCS sector classification)
For a more precise assessment:
- Financial information: total asset value, revenue
- Resilience strategies
Methodology Documents

Transition Risk
Transition Risk Key Metrics
Scope 1+2 and Scope 3 carbon intensity by revenue (in tCO2e/mUSD)
Scope 1+2 emissions divided by NAV or EVIC (in tCO2e/mUSD)
Decoding Climate Risk: Find the Answers You Need (FAQ section)
TCFD defines transition risks as challenges stemming from new regulations, technological advancements, and changing market dynamics in the attempt to transition to a low-carbon economy. One of the main solutions to mitigate climate change is to impose a carbon tax to incentivise companies to reduce their carbon footprint. Accordingly, our transition risk assessment is based on carbon intensities and carbon tax.
Multiple years of research support our carbon metrics estimates. This includes the use of The Infrastructure Company and Classification Standard (TICCS) to classify infrastructure assets, as well as the TICCS+ Taxonomy and EDHEC Materiality Profiles to identify assets’ main activities and operations, their primary technologies, and their main sources of emissions. Our estimates further rely on public research articles that specify sector activities and reports from reliable institutions (e.g., EIA, IEA, NREL, World Bank), among others. For more details, please refer to our S1+2 and S3 methodology documents.
Data availability for some infrastructure sectors remains a challenge. Accordingly, some of our emission estimations rely on revenue- or activity-based models rather than statistical calibration. However, by combining a variety of data sources with reliable approaches and aligning them with widely accepted standards, such as the Greenhouse Gas Protocol, we can gain valuable and reliable insights into patterns of carbon intensity across TICCS superclasses. Moreover, our methods and models are validated against emission estimates from various sources, including international organisations (e.g. World Bank, WRI, EIA) and reported data from companies’ sustainability reports.
We provide carbon intensities by revenue for Scope 1+2 and Scope 3 emissions at the asset/company level. For all approaches, we aim to include as much reported data on S1+2 emissions as possible to improve the robustness of the results. For Scope 3 carbon emission intensities, our methodology estimates these using a top-down approach. Our approach focuses on systematic features common to assets within the same sector rather than idiosyncratic characteristics, which are difficult to capture for multi-tiered supply chains. We focus specifically on the operational upstream and downstream activities of infrastructure assets, excluding emissions from the construction and disposal phases.
We calculate Data Quality Scores (DQS) for the data used to quantify Scope 1, Scope 2, and Scope 3 emissions. The DQS offers decreasing quality scores ranging from 1 to 5, inspired by PCAF.
Yes, we do consider the effects of future climate scenarios. All our underlying metrics are available across seven scenarios that describe possible pathways for a large number of macro-financial quantities, spanning two time horizons: until 2035 and 2050. For the Climate Exposure Rating, we calculate all metrics under the most likely scenario, while for the Climate Risk Rating, we consider the weighted averages across all scenarios, based on their probabilities.
All metrics are aligned with well-accepted international standards, like the Greenhouse Gas Protocol and the Partnership for Carbon Accounting Financials (PCAF). If available, our methodology follows additional recommendations from sector-specific institutions. We further provide a Data Quality Score (DQS) that highlights the reliability and precision of the underlying data. The DQS are aligned with PCAF, offering a clear benchmark to evaluate data completeness, consistency, and relevance.
The carbon metrics are updated on an annual basis using multiple sources of data, such as:
- Reported emissions from financial and sustainability reports
- Public information, like public data from international organisations (e.g. the World Bank, EIA, WRI), websites of companies, and other reliable sources
- Commercial datasets that provide asset characteristics, such as geolocation, capacities, output production, or volumes of operations
For more details, please refer to our S1+2 and S3 methodology documents.
Methodology Documents
ClimaTech
ClimaTech is the world’s largest knowledge base for strategies and technologies, which supports companies in their efforts to mitigate risks, adapt to climate change, decarbonise, and build resilience — the database offers actionable insights for sustainable and resilient assets across all TICCS infrastructure sectors. Our ratings use the provided indicators on strategies’ effectiveness to re-evaluate pclimate risks and adjust the CER and CRR.
For more information, please visit the ClimaTech website.
ClimaTech Database
Effectiveness:
— a) Very High ≥95% · b) High 65–94% · c) Medium 35–64% · d) Low 5–34% · e) Very Low <5%
Level of protection:
— Floods: i) Very High: > 1:1000 year event · ii) High: 1:100 < x ≤ 1:1000 year event · iii) Medium: 1:50 < x ≤ 1:100 year event · iv) Low: ≤ 1:50 year event
— Storms: i) Very High: > 1:1000 year event · ii) High: 1:100 < x ≤ 1:1000 year event · iii) Medium: 1:50 < x ≤ 1:100 year event · iv) Low: ≤ 1:50 year event
— Heat: i) Very High ≥ 50 degrees centigrade · ii) High 40 ≤ x < 50 degrees centigrade · iii) Medium 35 ≤ x < 40 degrees centigrade · iv) Low < 35 degrees centigrade
1.The figures presented are based on the best available research at the time of writing and reflect our current understanding.
2. Data has been sourced from a range of literature, including academic publications, technical reports, industry guidance documents, engineering manuals, and case studies. These values are indicative only and should be treated as general benchmarks or ranges. The real-world effectiveness of any given strategy is asset-specific and depends heavily on site conditions, design choices, and implementation quality.
3. For physical risk damage reduction strategies, protection levels are defined based on expert judgment regarding typical hazard intensities that resilience measures are designed to withstand. These thresholds may vary depending on the applicable national or regional design codes, as well as the asset’s specific risk profile and the nature and quality of the infrastructure being built.
Decoding Climate Risk: Find the Answers You Need (FAQ section)
Yes, we can account for companies’ adaptation measures and strategies at the asset level. We use our proprietary database, ClimaTech, which incorporates 100+ distinct strategies across 101 infrastructure sectors, resulting in approximately 1,800 sector-strategy applications. These strategies are assessed based on their sector-specific effectiveness levels and key enabling technologies, drawing on insights from more than 200 academic papers, technical documents, and government reports. We present the effectiveness of decarbonisation strategies (transition risk) in terms of avoided emissions in percent, and the effectiveness of resilience measures (physical risk) in terms of damage reduction in percent. A review board of experts from academia, the private sector, construction standards, sovereign wealth funds, public pension funds, consulting, and regulatory bodies validates the database for relevance and robustness, ensuring adherence to the highest scientific and industry standards. For more information, please visit the ClimaTech website.
Our physical risk model for wildfires primarily includes historical burnt data, climate conditions, and vegetation density to estimate wildfire probabilities. While we do not include localised vegetation management like creating defensible space, controlled burns, or fire-resistant landscaping, we do assess direct measures on a company level, and – depending on the evaluation through ClimaTech – adjust the ratings accordingly.
Methodology Documents
ClimaTech
Overview
ClimaTech
Executive Brief
ClimaTech Non-
Renewable Power
(IC10)
ClimaTech
Environmental Services
(IC20)
ClimaTech Social
Infrastructure
(IC30)
ClimaTech Energy and
Water Resources
(IC40)
ClimaTech
Data Infrastructure
(IC50)
ClimaTech Transport
(IC60)
ClimaTech Renewable
Power
(IC70)
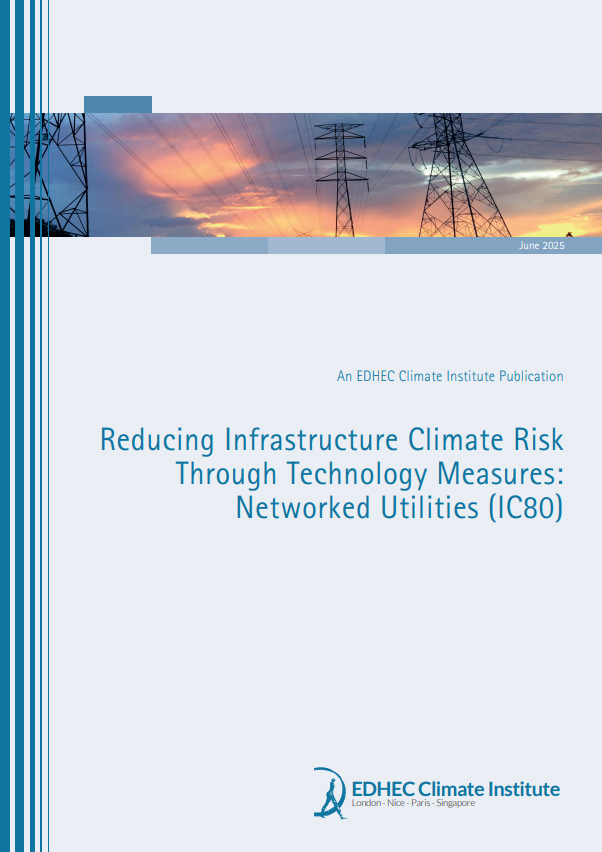
ClimaTech Networked
Utilities
(IC80)
